I Made a Web Map!

For one of my side projects I used Leaflet.js to display a mobile friendly interactive map of Berlin. I decided not to use an "ordinarily" looking map, because I was interested in learning how to make and style my own map. I got my inspiration from this project, which aims to map bathing sites in Berlin.
I use Mapbox to host the tile layers. There are other hosts or one can also self-host. MapBox explains tile layers as follows:
A map is made of layers. Layers can be images, lines, and markers. Each layer can be placed on top of each other to build combinations and mashups. Understanding layers is core to mastering web maps.[1]
To build those layers and style them Mapbox developed TileMill, which is a free and open source software. (FYI: in case TileMill won't start for the first time, try to update it.)
The Agenda for creating your own map and use it in your web app looks like this:
- import your city's Open Street Map (OSM) data into a database
- setup the map in TileMill
- export the map to Mapbox
- integrate it into to my website with Leafletjs.
I'm going to explain each of the steps, but I also assume that you already have basic knowledge in web development. Btw., I'm on a Mac!
Import Berlin's OSM data into PostgreSQL and PostGIS
First, I added PostGIS to my PostgreSQL database and set it up for my geo data. "PostGIS (/ˈpoʊstdʒɪs/ post-jis) is an open source software program that adds support for geographic objects to the PostgreSQL object-relational database." [2]
brew update
brew install postgis
psql
create database my_db;
\connect my_db
create extension postgis;
\quit
I then installed osm2psql via this package "osm2psql is a command-line based program that converts OpenStreetMap data to postGIS-enabled PostgreSQL databases." [3]
For populating the database with data, I downloaded the berlin-latest.osm.pbf file and ran this command to import the data to my database:
osm2psql -cGs -d my_db -S /usr/local/share/osm2pgsql/default.style ~/Downloads/berlin-latest.osm.pbf
Setup the map in TileMill
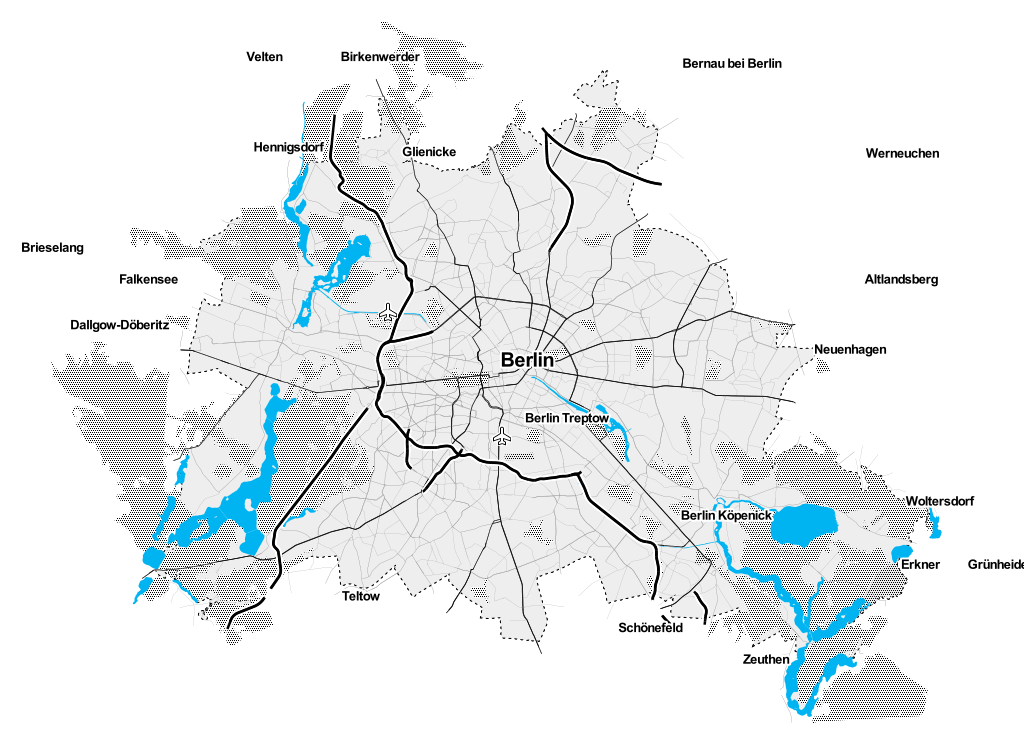
The next step is to use the geo data in my database in TileMill and style the data according to my taste. TileMill uses Carto CSS to style maps, which is a styling language every similar to CSS. Luckily, I found Aaron Lindman's Toner for TileMill, which offers (besides very cool looking Carto CSS styles) also a very quick setup!
Simply download it here and configure the setup by changing configure.py.sample to configure.py and open it in your favourite editor. Then change the name of the map and the database and saved+closed the file.
...
config["name"] = "Toner for Tilemill Test"
...
config["postgis"]["dbname"]   = "my_db"
...
After running the make.py from the terminal, I opened up TileMill and there it is, my new map project!
Use the map in Mapbox
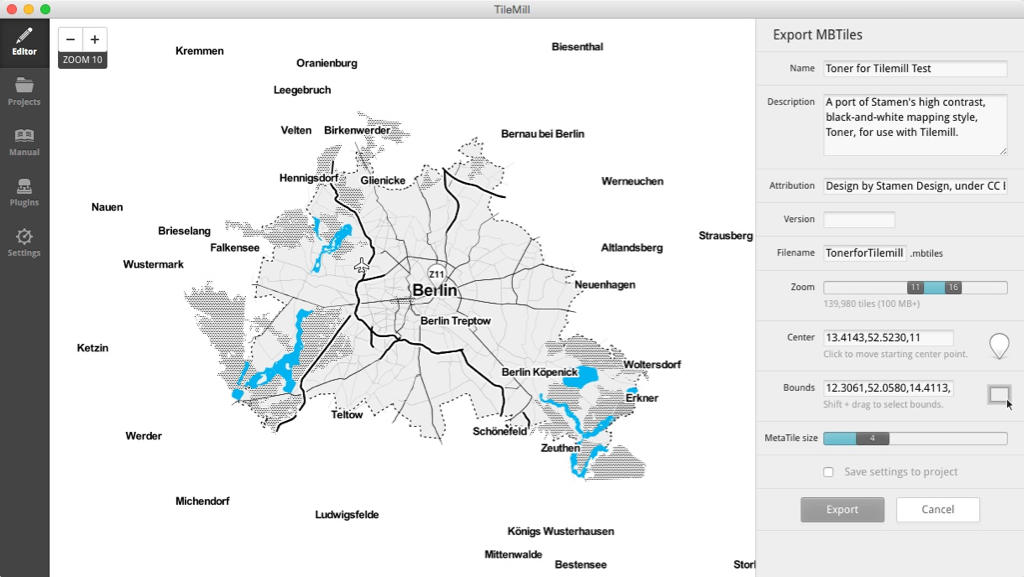
To use the map, use TileMill's export function to create a MBTiles file. I configured the zoom level between 11-16, because I'm currently on Mapbox's free plan and only have 100MB for map hosting. Click on the map to set the center of the map and press Shift and drag through the map to select your map's boundaries.

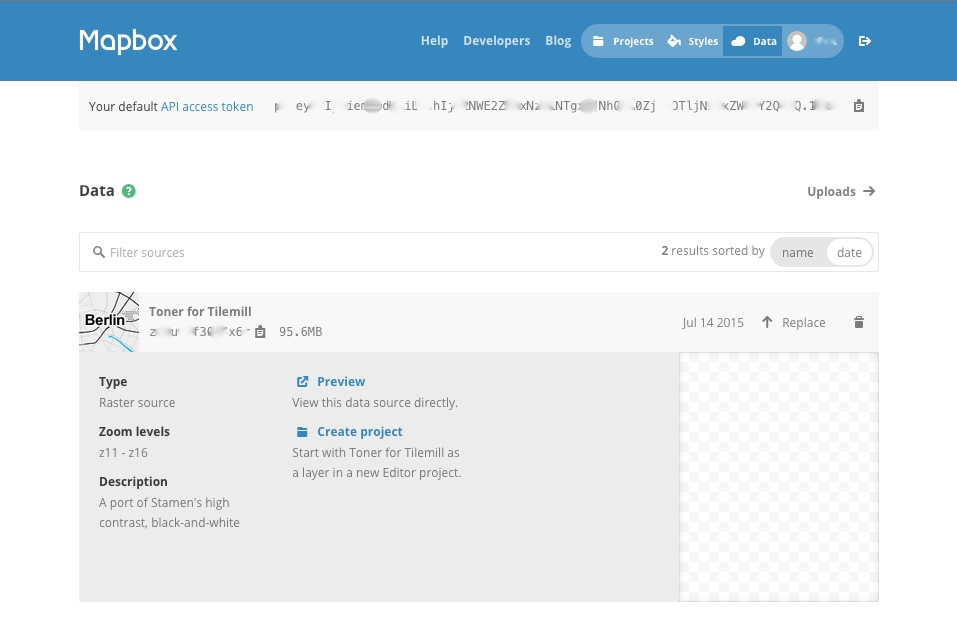
If you haven't signed up for a Mapbox account yet, now is the time. Afterwards, upload the .mbtiles file via Menu > Data > Uploads > Select A File and then click on the uploaded map and Create project.

Mapbox will redirect you to your new map project. Just click on save and the map is ready!
Website integration with Leafletjs
Using your created map is now very easy. Simply go through the Quick Start Guide on on Leafletjs. For the map's id and accessToken, go back to your map project's page on mapbox.com and find info panel. The HTML code snippet to embed the map contains those information. In Rails, I would recommend to use e.g. Figaro to set those information as environment variables.
Result
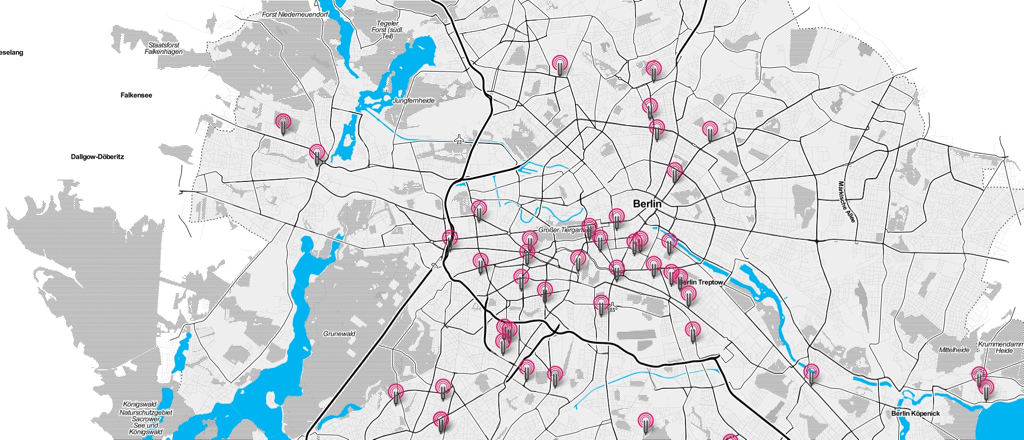
This is how the map ended up look like with styled location markers on it.

Sources
- https://www.mapbox.com/tilemill/docs/guides/osm-bright-mac-quickstart/
- https://github.com/aaronlidman/Toner-for-Tilemill
- http://leafletjs.com/examples/quick-start.html